


Draw a Bar Graph with Kids
📚 Special sale announcement at the end!

Previously, I wrote about why teaching our kids the basics of graph interpretation is essential in today’s data-driven world. But you don’t have to wait until middle school to learn this important skill. It can start with simple and fun hands-on activities at home.
Here’s how you can get started. The activity below shows kids how to build a bar graph by counting characters or objects in a picture book. No special counting book required! Here’s how to get started:
1. Pick your picture book
Choose any book with plenty of countable elements. It could be a favorite story (or my copy of ABC’s of Statistics with Cats). We’ll use the latter as our example, but feel free to grab whatever your child likes. If you’re using my book, be sure to use my FREE templates.
2. Decide what to count
Ask your child: “What’s most interesting in this book?” For ABC’s of Statistics with Cats, you might count:
Cats by color (calico, orange, white, grey, etc.)
Different animals (cats, bugs, dogs, etc.)
This is your data! Encourage kids to pick one feature so the graph stays focused.
3. Create a tally chart
This is a helpful intermediate step to collect the data before we draw a graph. On a simple sheet of paper, draw lines for each category you’ll count. For every orange cat you spot, make a single tally mark. Cross four tally marks to make a five.
4. Draw your bar graph
This is the fun part. Ideally, you can use graph paper to make the graph look neater.
Draw the axes
Horizontal (X) axis for categories (cat color).
Vertical (Y) axis for quantities (number of cats).
Label each axis
Under each tick on the X-axis, write the category name: “Calico,” “Orange,” etc. You can even get creative by drawing and coloring cats instead of writing down the category name.
Along the Y-axis, mark numbers starting from zero, increasing by one or two units. Make sure there is even spacing between them.
Choose a title
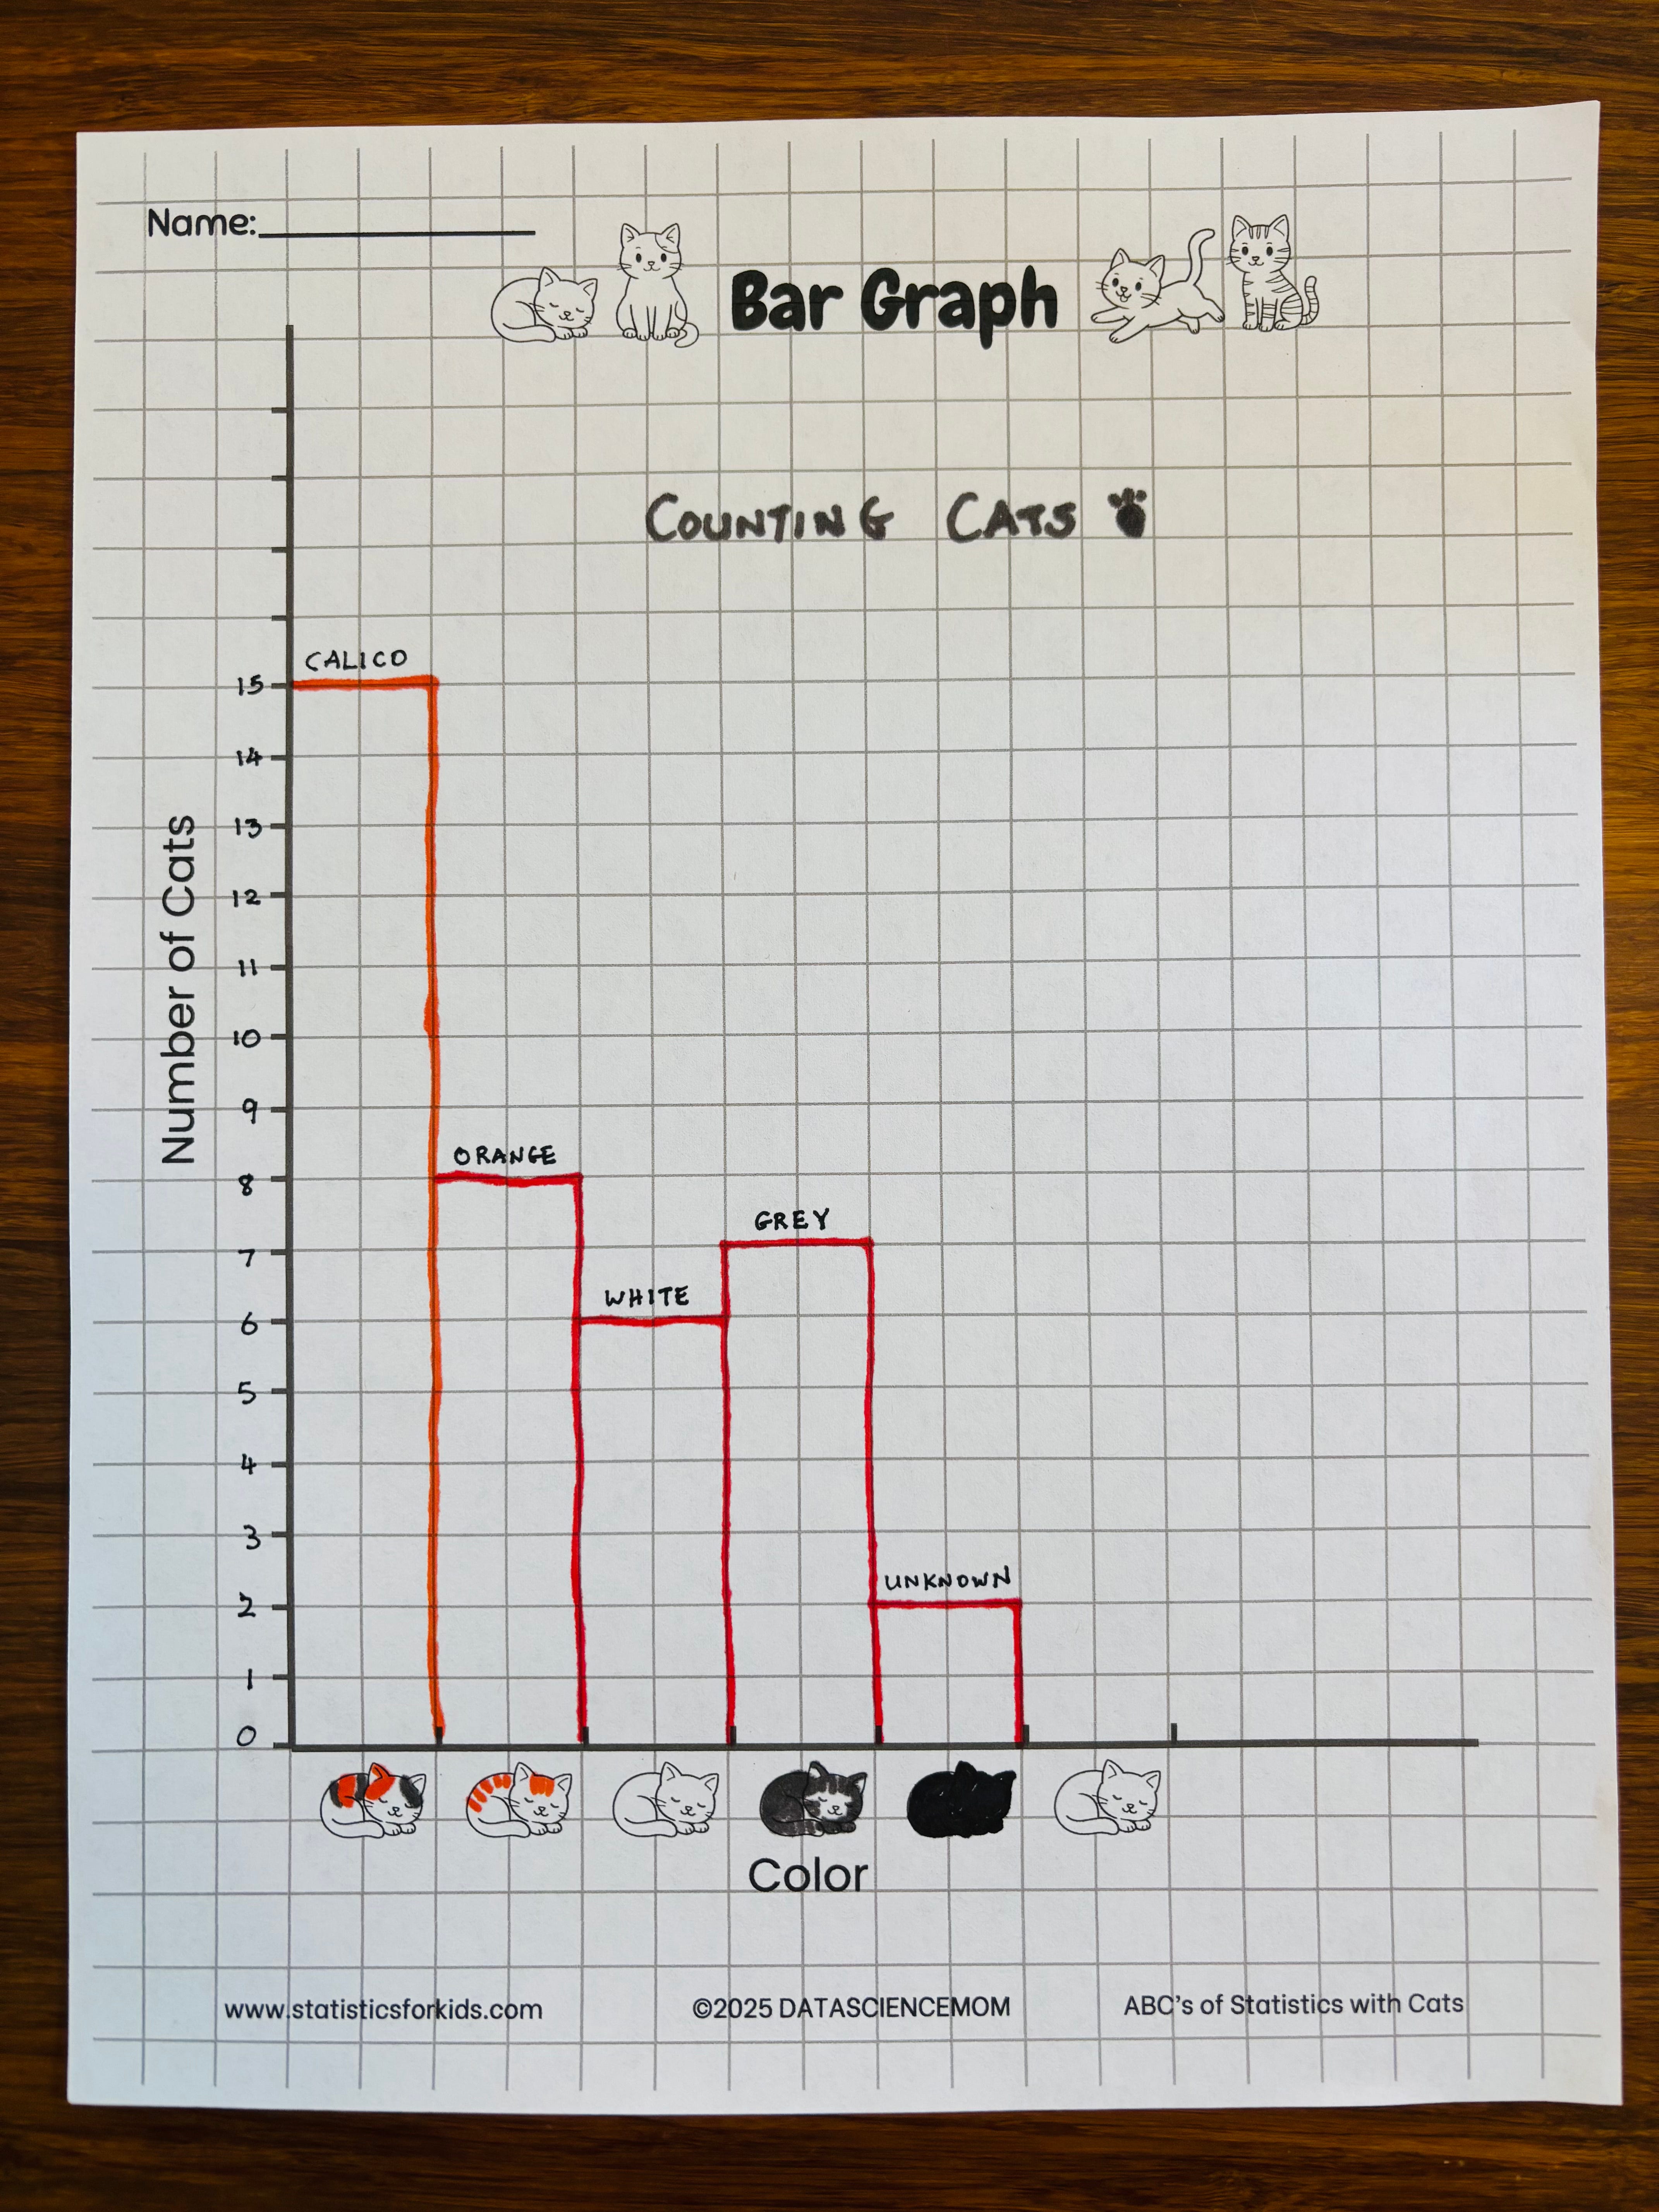
At the top, write a clear title like “Cats by Color.” We decided to add a silly title, “Counting Cats,” to keep things fun.
Plot your bars
For each category, draw a bar rising to the tally total. If orange cats totaled 8, draw a bar up to “8” on the Y-axis above “Orange.”
Add (optional) finishing touches
Color each bar to match the category (e.g., orange for orange tabby cats).
Include a small legend if you use colors or patterns.
And voilà—you’ve turned cats illustrations in a book into a powerful stats lesson! This activity builds counting skills, organizes data with tally charts, and visualizes information through bar graphs. Plus, it’s a fun way to reinforce early math concepts without needing fancy materials.
5. Key elements to remember
Axes: Start at zero on your axes, particularly the y-axis.
Labels: Make your categories and numbers easy to read.
Scale: Keep equal intervals on the axes so bars aren’t misleading.
Title: Tell your audience what the graph is showing.
Have your little statisticians tried this yet? Share photos of your tally charts and bar graphs with me (datasciencemomlife@gmail.com). Let’s celebrate every step in the learning journey!
🇺🇸 May 21-26 only: $8.99 for ABC’s of Statistics with Cats!
To celebrate Memorial Day, I'm running a special sale on ABC’s of Statistics with Cats — a fun and non-intimidating way to introduce kids to basic stats concepts.
🎉 Now just $8.99 on Amazon (normally $11.99)
📆 Offer ends Monday, May 26
📚 For upper elementary and above kids who love cats, numbers, and curious questions
🎁 Plus, make sure to check my free printables!
Whether you're a teacher, homeschooler, or math-loving parent, this book brings stats to life from A to Z.
🛍️ 👉 Grab your copy here!
Thank you for all your support, and have a restful, meaningful Memorial Day weekend! 🇺🇸