Learning multiplication is a right of passage in elementary mathematics. Recently, an old article published in The Guardian (a British newspaper) caught my eye. A 2013 study from the Caddington Village School in Bedford, England offered helpful insights for parents on where children stumble in their times-table learning. The study involved 232 children answering over 60,000 multiplication questions. While I didn’t find more details about the study design, it looked like the children took the multiplication tests on an app.
I looked at the dataset myself, and the insights I share here are based on my own analysis.
The trickiest problems
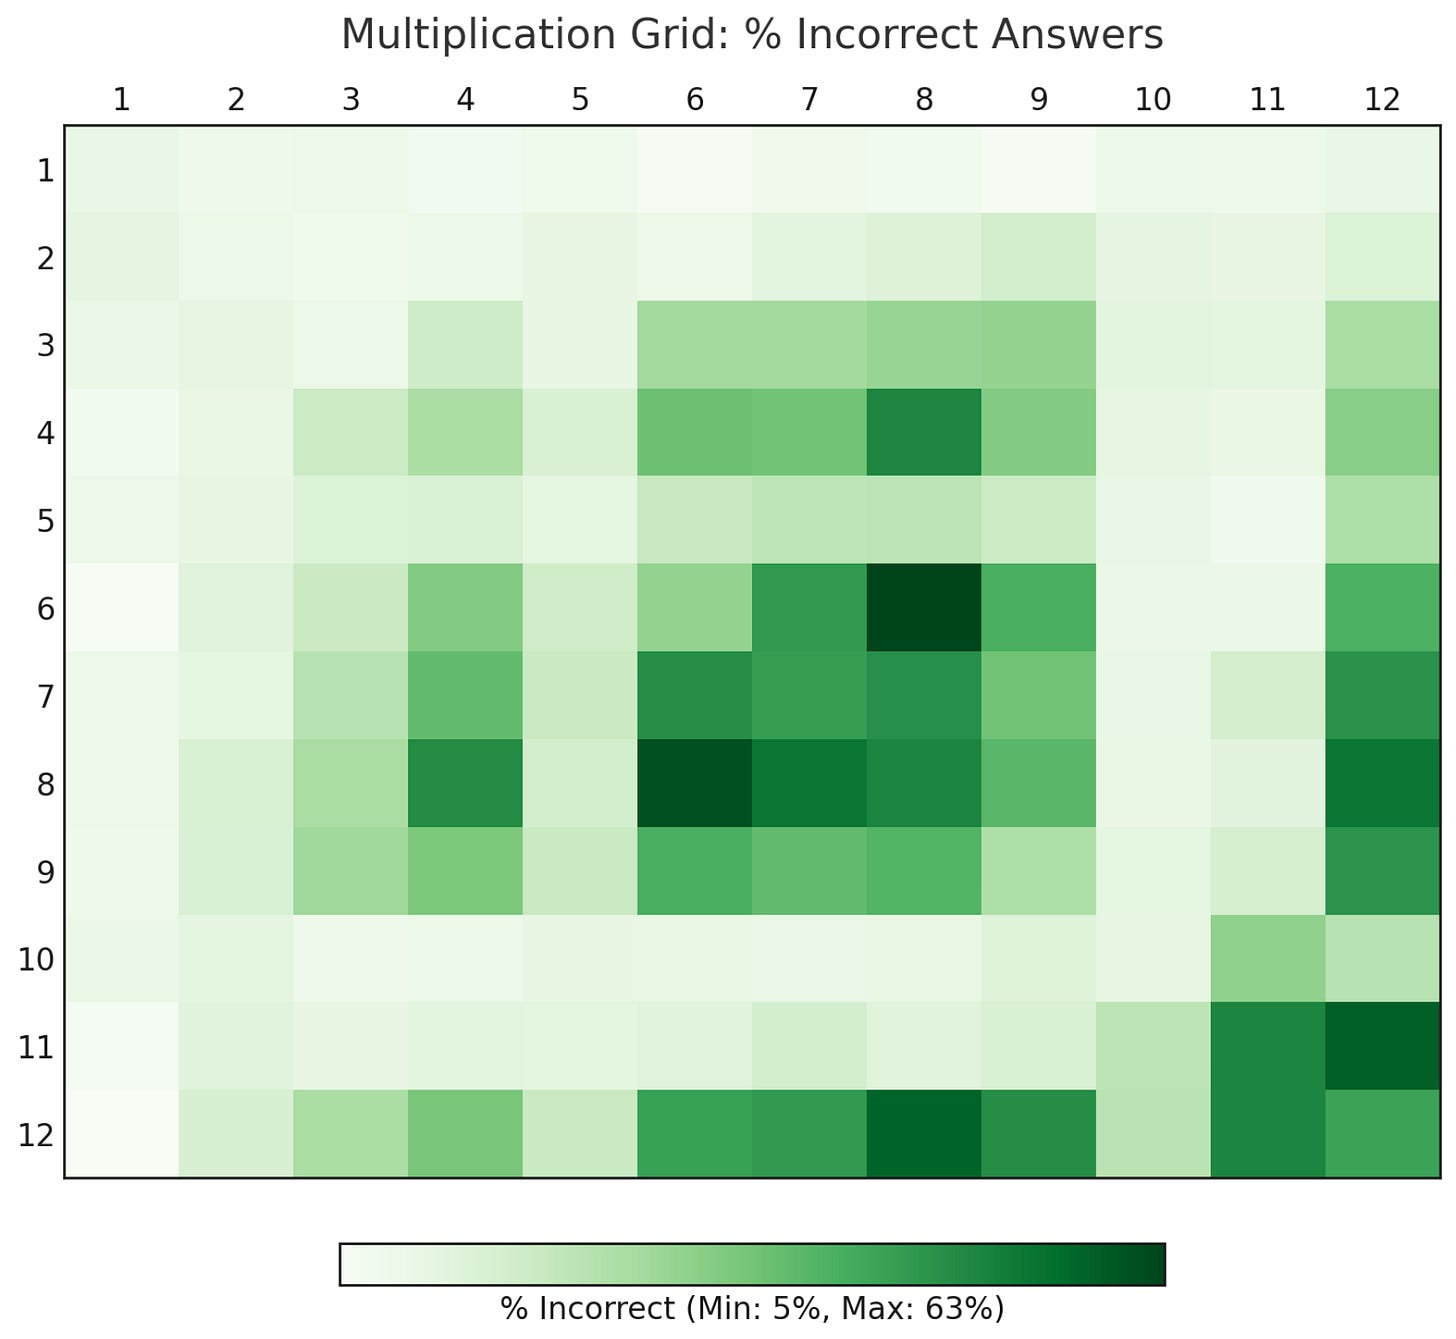
Here is a heat map, a special type of color-coded chart, laid out like a typical multiplication grid. The color coding tells us the error rate (% incorrect) for each multiplication problem. The darker the square, the higher the number of incorrect responses. For example, the problem “4 × 8” had an error rate of about 50%.

Across all problems, the kids got ~78% of the questions right on average, but there were some notable gaps.
The hardest problem was 6 × 8 (and 8 × 6), with kids getting it wrong over 60% of the time.
Other tough problems included 11 × 12, 12 × 8, 8 × 7, and 11 × 11 among others.
The easiest problems
Interestingly, 12 × 1 was the easiest, with fewer than a 5% error rate, followed by 6 × 1 and 1 × 9.
I assumed the easiest problem was 1 × 1, but oddly enough, the error rate was close to 10%! We could speculate on why the error rate was so high. I suspect that it might have been the first problem in the test and some kids thought it was “1 + 1” (my kiddo clued me on that!).
Speed vs. accuracy
The app that the kids used to take the test had also logged the response time (speed). The blue heat map below shows us the kids’ average speed in seconds for answering each multiplication problem. The darker the square, the more time taken to answer the problem. For example, for “4 × 8,” kids took about 7 seconds to answer the problem—but got the answer right only about half the time, as noted earlier.
Speed didn’t always mean correctness. Unsurprisingly, the fastest problem answered was 1 × 1 (average of 2.4 s), but even that had a 10% error rate.
On the other end, 9 × 12 took the longest to answer (roughly 8s on average), followed by 8 × 12, 7 × 12, 6 × 12, and 8 × 6.

Boys vs. girls
While the dataset didn’t include the gender breakdown, the Guardian article reported that boys tended to be quicker but made more mistakes. On average, boys had a 32% error rate on problems, taking 4.2 s per question. Girls were slightly slower at 4.6 s, but more accurate with a 22% error rate.
Of course, the statistician in me immediately thought about whether these differences were something to be concerned about (i.e., “statistically significant” in other words). Because I didn’t have access to data for each kid, I had to use some assumptions to run some tests. I won’t go into those results here, but it makes sense to focus on accuracy over speed when kids are still learning their times tables.
💡 What this means for parents
While this data has limitations (i.e., it’s based on 232 kids in a small town in England back in 2013, among other reasons), here are some useful takeaways.
What to focus on: The heat map suggests that the kids in this study made more mistakes for the 4, 6, 7, 8, 9, and 12 times tables. In particular, certain 8 and 12 times tables problems were especially tricky for them. These may be good areas to focus your child’s practice.
Targeted practice: 6 × 8, 11 × 12, 12 × 8, 8 × 7, 11 × 11, and 12 × 11 are some examples of problems that may require more targeted practice for accuracy. The green heat map provides more examples.
Start easy: 1, 2, 5, 10 and parts of the 11 times tables are good ones to tackle first because they’re easier and can help build confidence.
Balancing speed with accuracy: I would focus on accuracy first. Then I’d graduate to gentle timed practice later, ensuring speed doesn’t compromise accuracy. The blue heat map suggests which times tables to focus on to build extra practice for speed (i.e., 3, 4, 6, 7, 8, 9, some 11 and 12) with more targeted practice for 12 times tables problems.
Customize: Of course, each learner is different. These are general suggestions based on one study, so your child may find other problems trickier.
I’m curious to hear about your experience supporting kids with “times tables” practice at home. Let me know in the comments or reach out to me over DM here or on Instagram.


